The coverage map format has now changed, and the newer coverage maps now show a smaller general coverage area and do not show fringe reception areas. The change can be seen by comparison of an old and new coverage map for a particular station. I happen to have memorialized the old coverage map for station WXN69 in Sister Bay, Wisconsin, so it can provide the example:
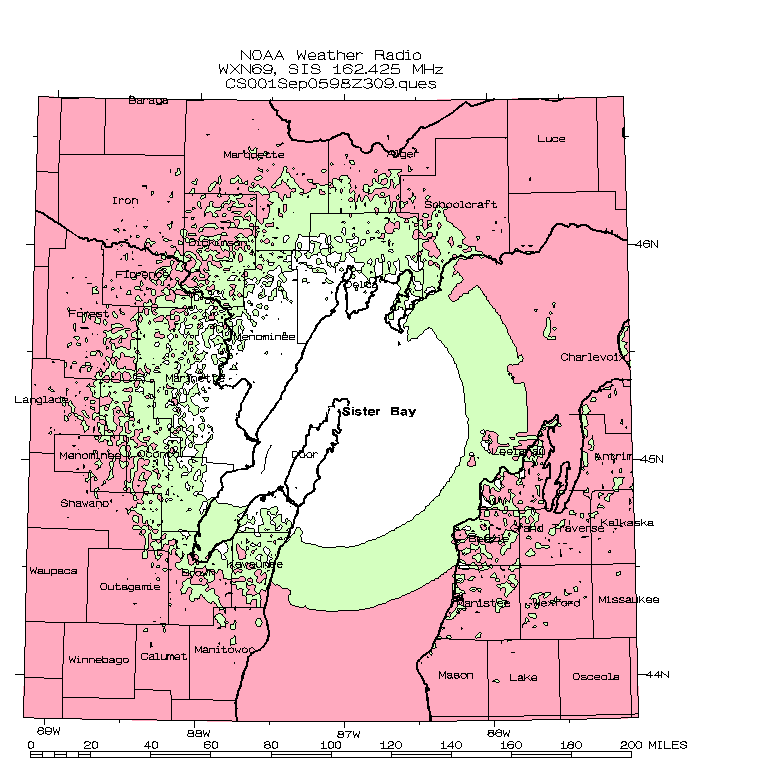
WXN69 coverage in old format. White is reliable coverage, green is fringe coverage.
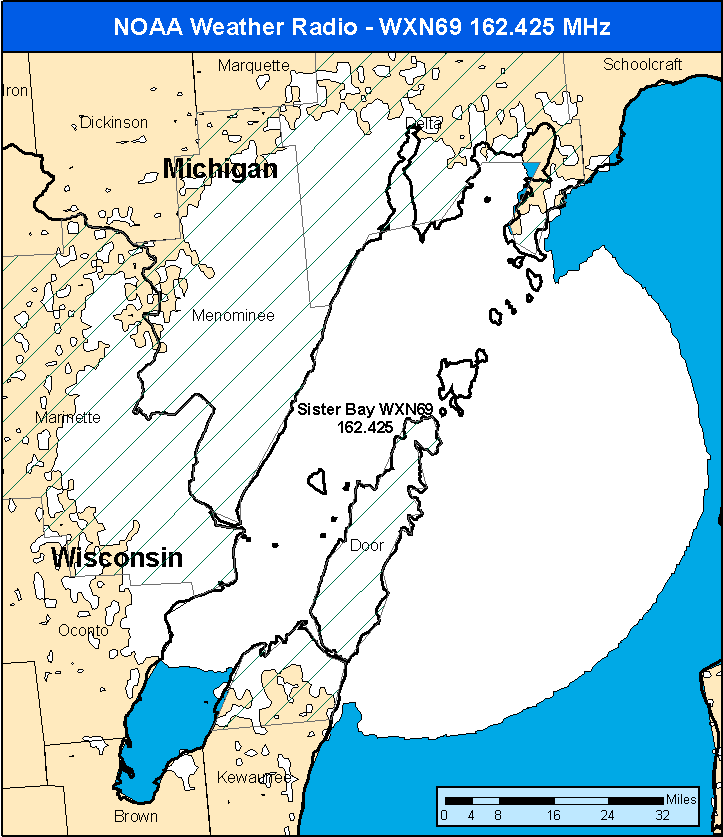
WXN69 coverage in new format. Only the white or reliable coverage contour is shown.
NOAA maintains a webpage that has a good index to all their transmitter sites and coverage maps. From this index you can find distant NOAA stations for your area that will provide a suitable signal for testing. On the index page, the coverage map signal level is specified: areas shown in white represent locations in which the NOAA transmitter should produce a signal of level of greater than 18 dBuV or what is deemed to be reliable coverage. The outer edge of the white coverage area is a predicted signal strength of 18 dbuV.
A signal level of 18 dBuV is equivalent to -89 dBm, or 18 dB more power than minimum sensitivity of -107 dBm. A signal of that strength should be very solid, clear, and noise-free copy on your receiver. For weaker signal testing, use a transmitter location whose coverage area in white does not include your location. Your receiver location should be beyond the white coverage area by a distance of perhaps 25-percent greater in order to provide a weaker test signal, around the 1-uVolt level, for receiver testing.
Also note that the listings of stations for each state in a table is provided by state-based index pages. The transmitter power is shown in those tables. Transmitter power of NOAA weather broadcast stations varies from 1,000-Watts to as little as 200-Watts.